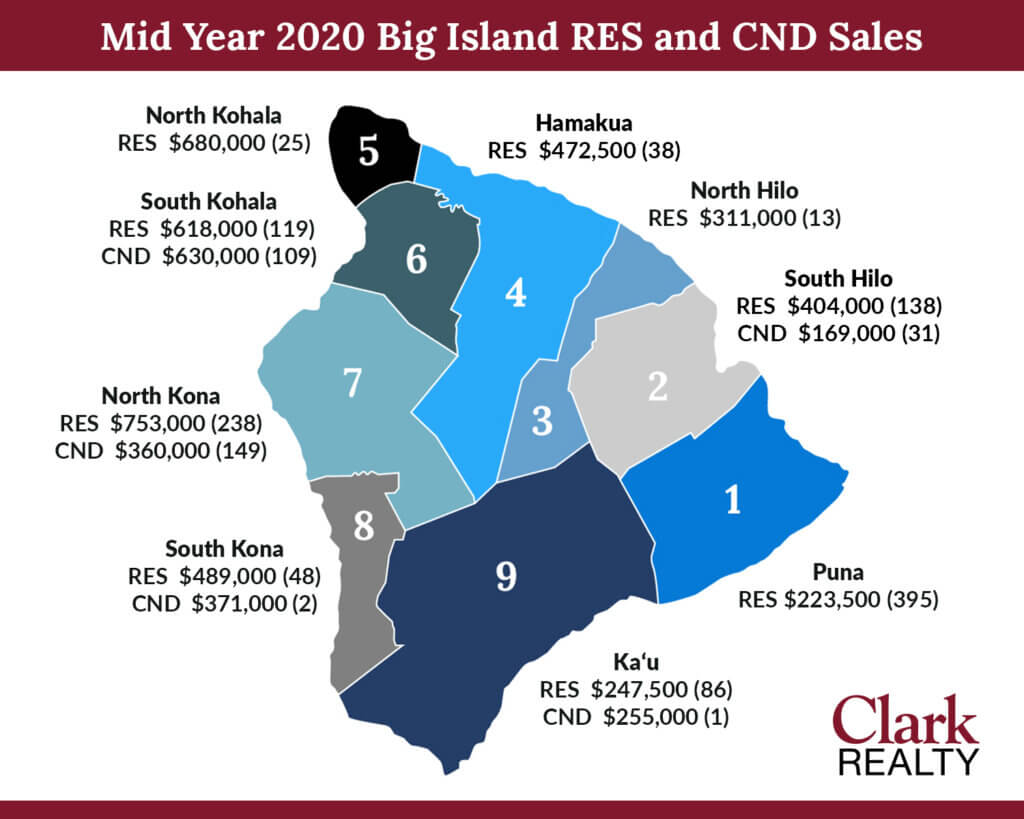
Market Conditions July 2020
The May 2020 real estate sales market showed the full effect of the Covid-19 virus pandemic on Hawaii Island real estate sales and the positive June stats show the recovery off the May bottom. This is primarily because May closed sales were booked in March and April after the shelter in place, 14-day visitor quarantine and Short Term Vacation Rental ban were all in place. All negative for buyer and seller psychology. The June sales show the effects of multiple positive developments including the State’s lifting of local inter-island travel restrictions without quarantine and the announcement that as of August 1, out of State travel would be allowed without 14-day quarantine with a negative Covid-19 test within 72 hours of arrival. These positive developments didn’t change the low inventory numbers but it does have an effect on buyer behavior I believe. I put Kulalani at Mauna Lani into escrow yesterday and had 4 contracts submitted on KaMilo at Mauna Lani 214 all within the last week. None of the contracts were successfully negotiated on KaMilo 214 but I’m hopeful that Kulalani 1902 will close quickly.
I will continue to monitor the effects and report on the number of units in escrow and closed sales as we go forward and update August 1. Values at this point have remained steady as new listings are few, indicating sellers are reluctant to list in the middle of the current negative conditions, which is positive for values as few listings keep our available inventory low. The number of Sales have declined faster than the decline in the number of new listings coming on the market so in some areas and classes of real estate, the average sold price has actually increased. As restrictions on Short Term Vacation Rentals to locals is now ok and will be approved to out of State travelers on August 1, sales should continue if for no other reason than possibly higher and more positive buyer sentiment. This is all good news for values unless inventory increases disproportionately to buyer interest due to seller distress due to financial or other life events. Hopefully the restoration of short term vacation rental income for owners from out of state visitors and locals, will buoy owners holding costs.
Average Sales Price Highlights
For the first 6 months of 2020 regarding average Sales Price:
- Island-Wide-Residential average sales price has increased +4.22% year over year.
- Island-Wide-Condominium average sales price declined slightly -2.67%.
- South Kohala-Residential average sales price increased +4.44%.
- South Kohala-Condominium average sales price have increased +22.09% compared to June 2019. This indicates the value of the “pool “ of sold units averaged much higher in the first 6 months of 2020 than the first 6 months of 2019. $516k in 2019 vs. $630k in 2020. This should average downward in the next 6 months to give a more realistic appreciation/depreciation average sold price.
- North Kona, Residential average sales price has increased +15.80%. This again is probably because of the low number of sales not that demand has picked up greatly.
- North Kona, Condominium average sales price has declined -4.17%.
Unit Volume Highlights
The chart below includes unit volume statistics for April, May and June 2020. Highlights of this chart show an improving market in June vs. May year over year even though all 3 months show big declines year over year. In May 2020, there was a -66.67% drop in the number of closed sales of condominiums in the South Kohala Resorts in comparison to May 2019. This district includes the Mauna Lani, Mauna Kea and Waikoloa Beach Resort. June 2020 shows a deceleration of this decline with a 56% drop in condo sales year over year. South Kohala also includes Waikoloa Village and Puako where Single Family Residences are the primary real estate. Check the chart below for residential and land comparisons.
In the adjacent North Kona district which includes the Kukio, Hualalai and Kohanaiki Resort/Communities, stats show a -67.44% drop in the number of condominiums sold and -56.67% less homes in May, 2020. June 2020 shows a deceleration of this decline with a -22.22% drop in residential sales and a -43.18% drop in condominium sales year over year. Both improvements over May 2020 declines and similar to the declines in April 2020.
The number of land transactions for Hawaii Island for the month of June dropped a very little -.74% island wide in June, 2020 (year over year) showing strength.
| Unit Volume Year over Year 2019/2020 | Hawaii Island (Overall) April 2020 | Hawaii Island (Overall) May 2020 | Hawaii Island (Overall) June 2020 |
|---|---|---|---|
| Residential | -18.14% | -43.53% | -25.36% |
| Land | -22.09% | -34.57% | -0.74% |
| Condominium | -61.47% | -63.29% | -48.00% |
| Unit Volume Year over Year 2019/2020 | South Kohala Including Resorts-April 2020 | South Kohala Including Resorts-May 2020 | South Kohala Including Resorts-June 2020 |
|---|---|---|---|
| Residential | -30.43% | -83.33% | -31.25% |
| Land | -40% | -90.00% | -40.00% |
| Condominium | -75.61 | -66.67% | -56.00% |
| Unit Volume Year over Year 2019/2020 | North Kona Including Resorts-April 2020 | North Kona Including Resorts-May 2020 | North Kona Including Resorts-June 2020 |
|---|---|---|---|
| Residential | -27.66% | -56.67% | -22.22% |
| Land | -16.67% | -53.85% | -75.00% |
| Condo | -64.41% | -67.44% | -43.18% |
Sales Volume Highlights
The chart below includes sales volume statistics or the total of all sales in a particular real estate class in a particular area for June, 2020. Highlights of this chart show:
- In the South Kohala Resort district which includes the Mauna Lani, Mauna Kea and Waikoloa Beach Resort there was only a -10.92% drop in sales volume of condominiums in the month of June versus June 2019. This indicates the condominiums sold were high price as unit volume decreased 56% year over year. In other words, there were almost half the number of units sold but the sales volume of those sold only decreased 10%. South Kohala also includes Waikoloa Village and Puako where Single Family Residences are the primary real estate.
- In the adjacent North Kona district which includes Kukio, Hualalai and the Kohanaiki Resort/Communities, stats show an increase of 32.72% in the $$$ volume of Homes sold and -37.08% less volume of condominiums closed year over year for the Month of June. Land $$$ volume dropped -60.05% island wide, year over year for the month of June, 2020.
- Market surprises are the sales volume increases for Residential properties in June year over year, Island Wide (+7.85%) and especially in South Kohala (+58.19%) and North Kona (+32.72%)
See Chart Below with $$ Volume details from our Multiple Listing Service for April, May and June 2020:
| $$$ Volume Year over Year 2019/2020 | Hawaii Island (Overall) April 2020 | Hawaii Island (Overall) May 2020 | Hawaii Island (Overall) June 2020 |
|---|---|---|---|
| Residential | -15.86% | -49.21% | 7.85% |
| Land | -68.01% | -61.70% | -60.05% |
| Condominium | -65.96% | -62.81% | -20.43% |
| $$$ Volume Year over Year 2019/2020 | South Kohala (Overall) April 2020 | South Kohala (Overall) May 2020 | South Kohala (Overall) June 2020 |
|---|---|---|---|
| Residential | -26.2% | -77.58% | 58.19% |
| Land | -35.75% | -94.55% | -70.92% |
| Condominium | -79.27% | -70.87% | -10.92% |
| $$$ Volume Year over Year 2019/2020 | North Kona including Resorts April 2020 | North Kona including Resorts May 2020 | North Kona including Resorts June 2020 |
|---|---|---|---|
| Residential | -10.77 | -50.76% | 32.72% |
| Land | -78.18% | -63.22% | -92.41% |
| Condominium | -59.77% | -57.04% | -37.08% |
Griggs Report
Click here for full Market Report for June 2020
Aloha,
The purpose of the Griggs Report is to provide the reader with accurate market data that gives an up-to-date view of the real estate market trends in N. Kona and Hawaii Island. Price Direction and Rate of Price Change are important indicators most are looking for. However price data is based on past sales. Current market inventory levels and pending sale trends show more current trends and give clues as to future price direction and rate of change. The report uses the “Pending Ratio”, the ratio of Pending Sales to Active Listing Inventory as a measure of this current supply/demand dynamic. By following the Pending Ratio’s over time the report uses charts to illustrate the trends. The higher the ratio number, the tighter or stronger the market demand versus supply.
- The latest data from Hawaii Information Service for N. Kona residential market shows a recent improving trend. The pending sales have increased from 79 to 89 in the past two weeks. The inventory continues to decline. The net effect is a sharp rise in the pending ratio. It could be that the Covid-19 virus has motivated some buying. Prices continue to show good year over year appreciation (up 7%).
- The price range data at the top of page 2 and the pie charts clearly show what is drive the substantial increase in price. Low inventory and low sales numbers in the price range below $700,000. The big year over year change from the pie charts is the increase in sales over $700,000. The percentage has jumped from 41% to 51%.
- The Hawaii Island Residential Pending Ratio has rebounded sharply in the last month. West and East Hawaii both increased. The Pending Ratios are all now in the Seller’s Market category (over 50).
- The Charts 5 and Chart 6 related to the distressed property now shows the five year trend on a quarterly basis. There has been a significant decline since 2015.
- The Condo stats suggest that perhaps the Covid-19 is having a detrimental effect the number of sales and to a lesser degree price. Inventory is up and pending sales are down. Thirty day sale are off 45% from last year.
- Land stats show a decline in inventory as well as pending sales. Sales numbers are off slightly. Thirty day sales are off 80% from a year ago.
- Page 6 is the Pending Ratio Summary page. This page offers a quick glance of the Pending Ratio trend for N. Kona Res., Condo, Land and Hawaii Island. This table shows improvement from last year and also since last month. The higher price ranges of the Residential market appear to be the most improved.
- The Page 7 Kona Residential Price chart since 1972 is updated with the new 2019 data. This is based on a data pool of similar homes many of which are either new sales or resales over the years. The total number of sales that make up the data pool is over 7,644 in the 23 subdivisions in the study. The result shows the 2019 average price was (plus six percent +6%) or $650,900.
- The Kona vs. West Coast report will updated in the next report.
If you distribute material from the Griggs Report online, on your website or blog, etc., please include appropriate attribution. An example is provided below.
The Griggs Report is published semi-monthly by Michael B. Griggs, PB, GRI
Sincerely,
Mike
Michael B Griggs PB, GRI, RB-12532
73-1201 Mahilani Dr.
Kailua-Kona, HI 96740
Direct PH: 808 936-8134
Email: 2mikegriggs@gmail.com
The Griggs Report is published semi-monthly by Michael B. Griggs, PB, GRI


